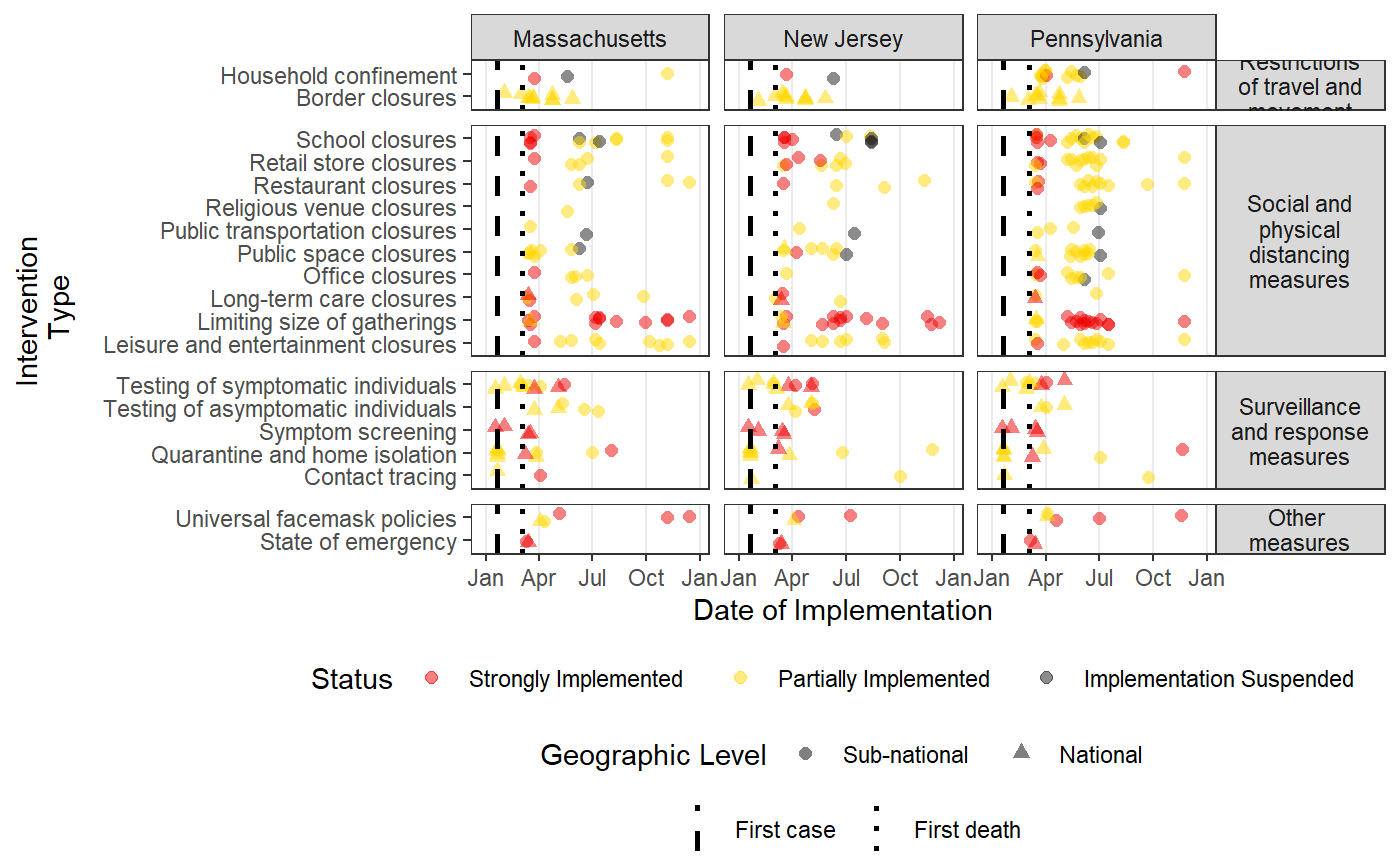
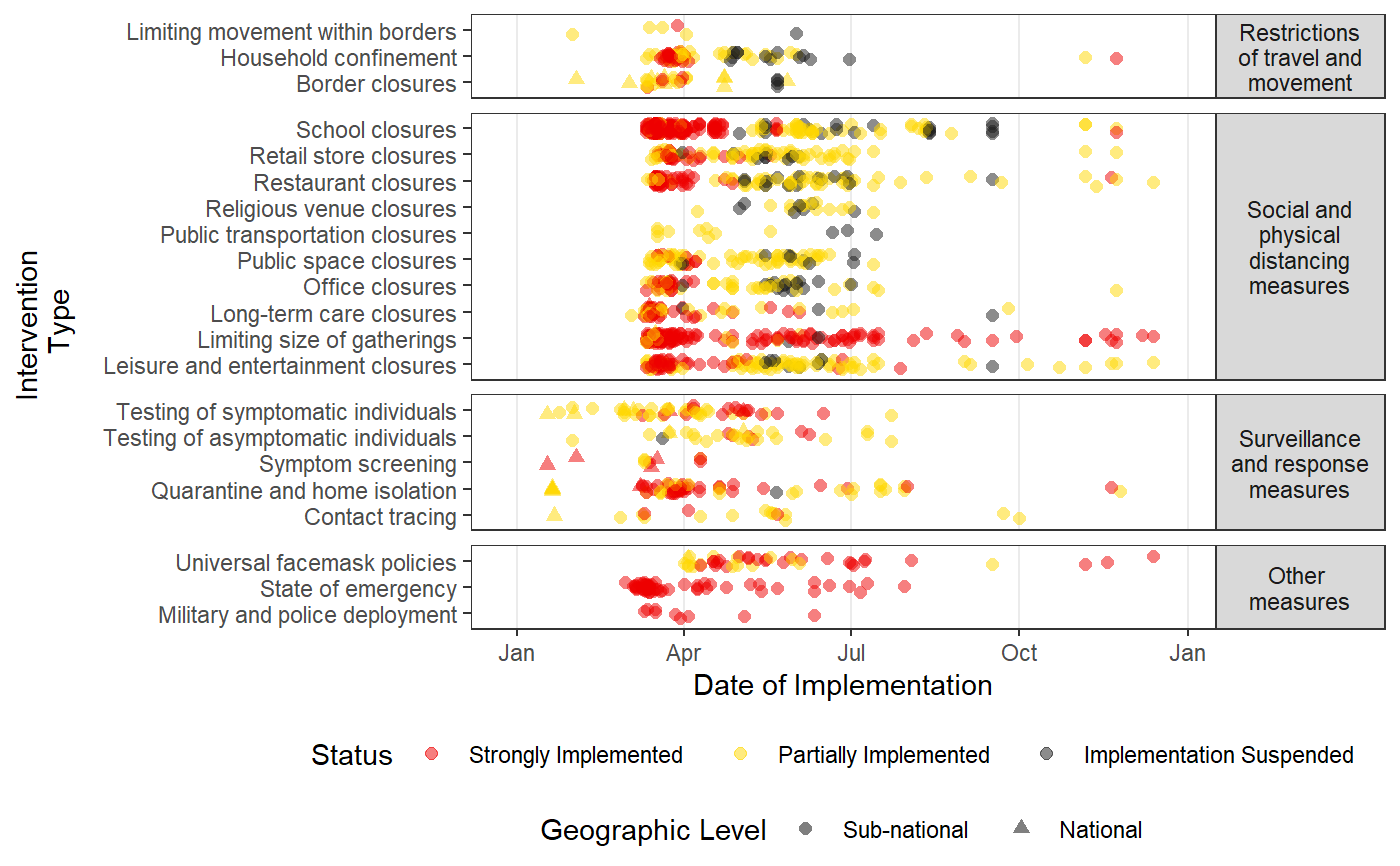
Plots a time-line of the intervention data in HIT-COVID
Source:R/intervention_timeline.R
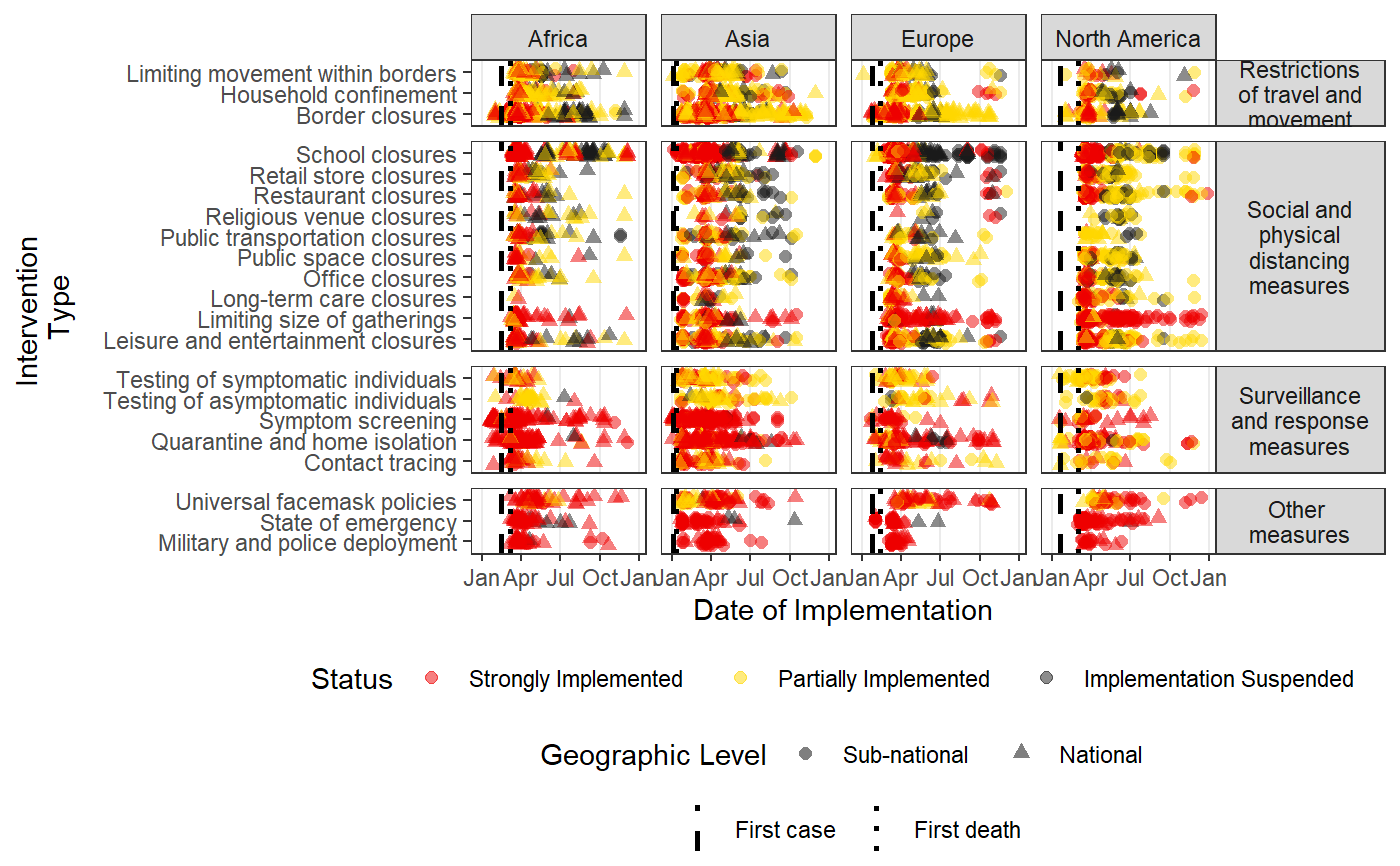
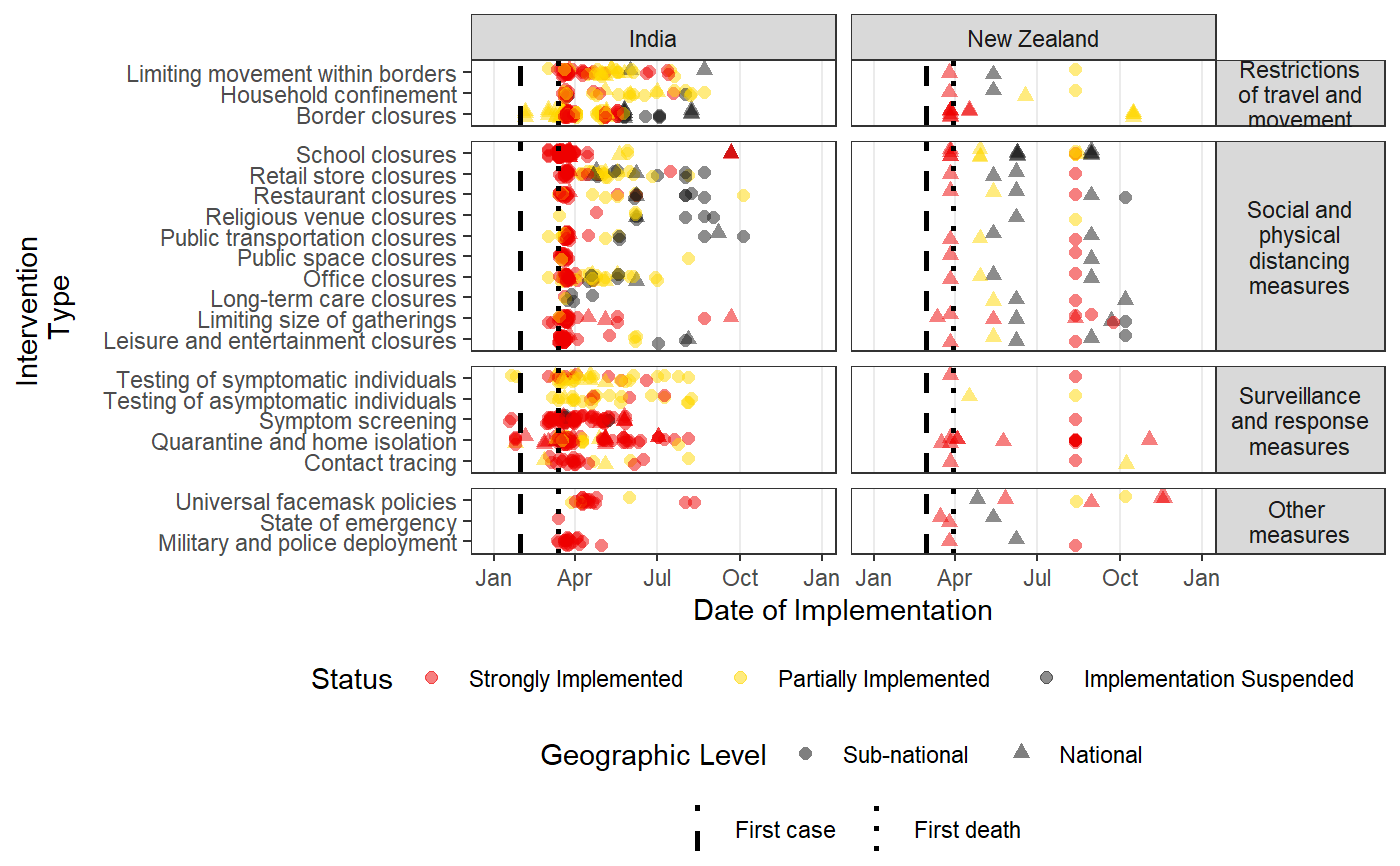
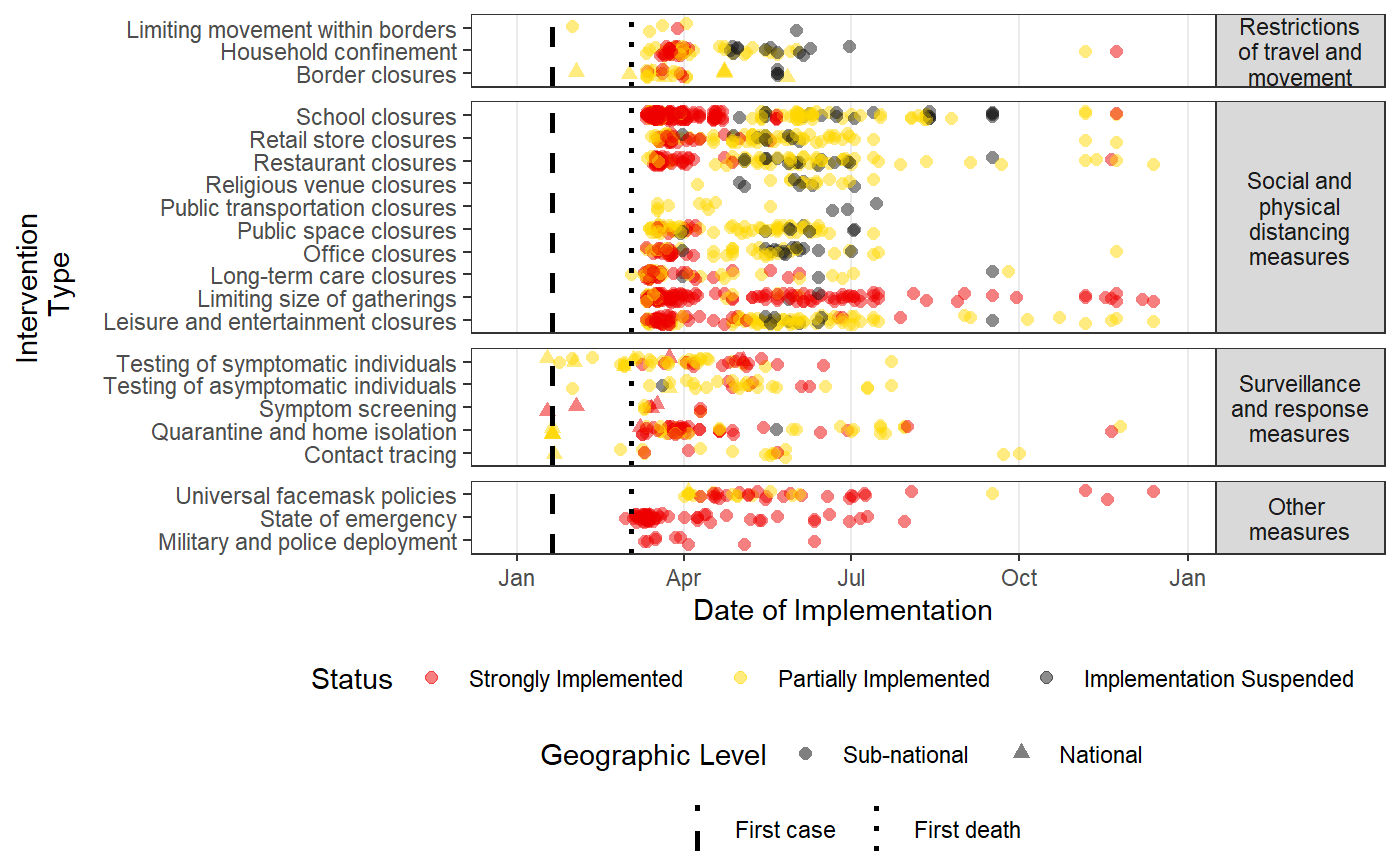
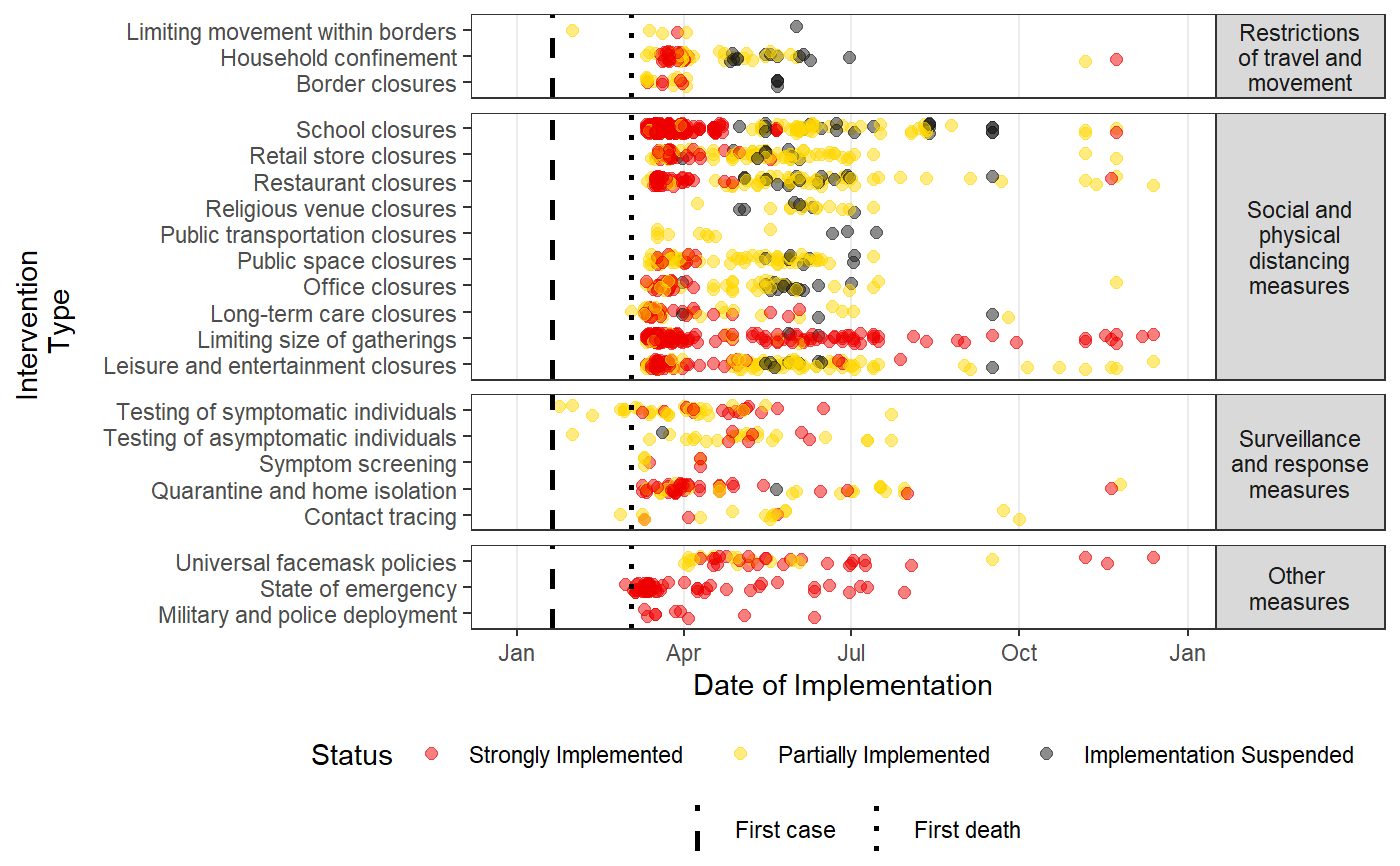
intervention_timeline.RdThis function creates a scatter plot of all of the intervention updates in the HIT-COVID database over time filtered to locations or intervention types as desired. It runs hit_filter and has many of the same arguments allowing great flexibility in what locations to include with the option to facet the plot by different location levels. If desired, it also draws vertical lines indicating the date of first case and first death in each facet provided.
intervention_timeline(
  hit_data,
  facet_by = c("none", "continent", "country", "admin1"),
  intervention_facet = TRUE,
  first_case_line = TRUE,
  first_death_line = TRUE,
  source = c("WHO", "ECDC"),
  continent = NULL,
  country = NULL,
  admin1 = NULL,
  locality = NULL,
  intervention_group = NULL,
  include_national = TRUE,
  include_admin1 = TRUE,
  include_locality = FALSE,
  usa_county_data = c("include", "exclude", "restrict_to"),
  verbose = TRUE
)
Arguments
| hit_data | the full HIT-COVID database pulled from GitHub, pulled using hit_pull |
|---|---|
| facet_by | the location level for the facet columns (one of "continent", "country", "admin1").
If no facets are desired specify |
| intervention_facet | a logical indicating if the different intervention groups should be faceted by their broad type ("Restrictions of travel and movement", "Social and physical distancing measures", "Surveillance and response measures", and "Other measures") |
| first_case_line | a logical indicating if a vertical line at the date of the first case should be drawn (default is TRUE). |
| first_death_line | a logical indicating if a vertical line at the date of the first death should be drawn (defulat is TRUE). |
| source | the source of the case data that is used to determine the date of first case and
first death if |
| continent | vector of continent names to filter the data to; should be one of
|
| country | vector of country ISO 3166-1 alpha-3 codes to include in plot (see geo_lookup for concordance of country codes to names) |
| admin1 | vector of the first administrative unit GID codes to include in plot (see geo_lookup for concordance of admin 1 codes to names). |
| locality | vector of the names of localities to include (this is a free text field) |
| intervention_group | vector of intervention group to filter the data to (see intervention_lookup column "intervention_group" or run get_interventions for options) |
| include_national | logical indicating if national-level data should be included (default is TRUE) |
| include_admin1 | logical indicating if admin1-level data should be included (default is TRUE) |
| include_locality | logical indicating if locality data should be included (default is FALSE) |
| usa_county_data | character string indicating how to deal with USA county-level data: one of "include", "exclude" or "restrict_to" (default is "exclude"). |
| verbose | a logical indicating if notes about excluded points and lines should be printed (default is TRUE) |
Details
The HIT-COVID database must first be loaded with hit_pull and fed into this function.
See hit_filter for details about each of the different filtering arguments. If desired the
plot can have facets for different location levels - continent, country, admin1 using the
facet-by argument. The default plot will also be facet by broad intervention categories.
This behavior can be turned off by setting intervention_facet to FALSE.
Additionally, by default, vertical lines will be drawn indicating the date of the first case and
first death using data from the source specified either within this function or in the
original pull of the dataset (if no source is specified the default is the WHO). This behavior
can be turned off by setting one or both of first_case_line and first_death_line
to FALSE.
References
Sam Abbott, Katharine Sherratt, Jonnie Bevan, Hamish Gibbs, Joel Hellewell, James Munday, Paul Campbell and Sebastian Funk (2020). covidregionaldata: Subnational Data for the Covid-19 Outbreak. R package version 0.6.0. https://CRAN.R-project.org/package=covidregionaldata
ECDC national data: https://opendata.ecdc.europa.eu/covid19
WHO national data: https://covid19.who.int
See also
Examples
#Pulling HIT-COVID database hit_data <- hit_pull() #Plotting all national and admin1 data in the database, in North America, Asia, Europe and Africa #faceting by continent intervention_timeline(hit_data, continent = c("Asia", "Europe", "Africa", "North America"), facet_by = "continent")#Plotting all data from India and New Zealand intervention_timeline(hit_data, country = c("IND", "NZL"), facet_by = "country")#Plotting all data from the USA intervention_timeline(hit_data, country = "USA")#Plotting just state-level data from the USA intervention_timeline(hit_data, country = "USA", include_national = FALSE)#Including three states (admin1 level) and faceting by state intervention_timeline(hit_data, admin1 = c("USA.22_1", "USA.31_1", "USA.39_1"), facet_by = "admin1", include_national = TRUE)#Removing vertical lines intervention_timeline(hit_data, country = "USA", first_case_line = FALSE, first_death_line = FALSE)
