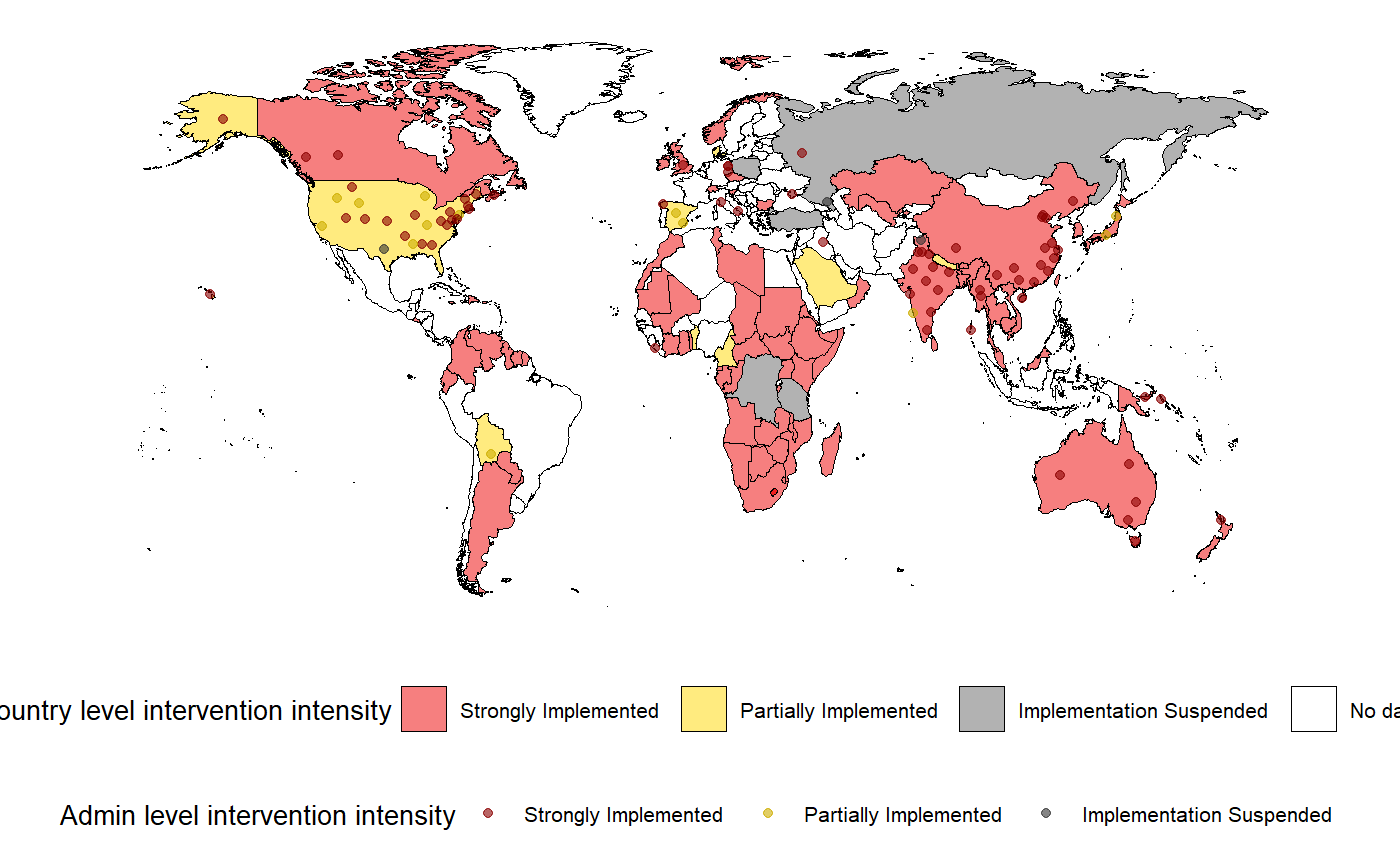
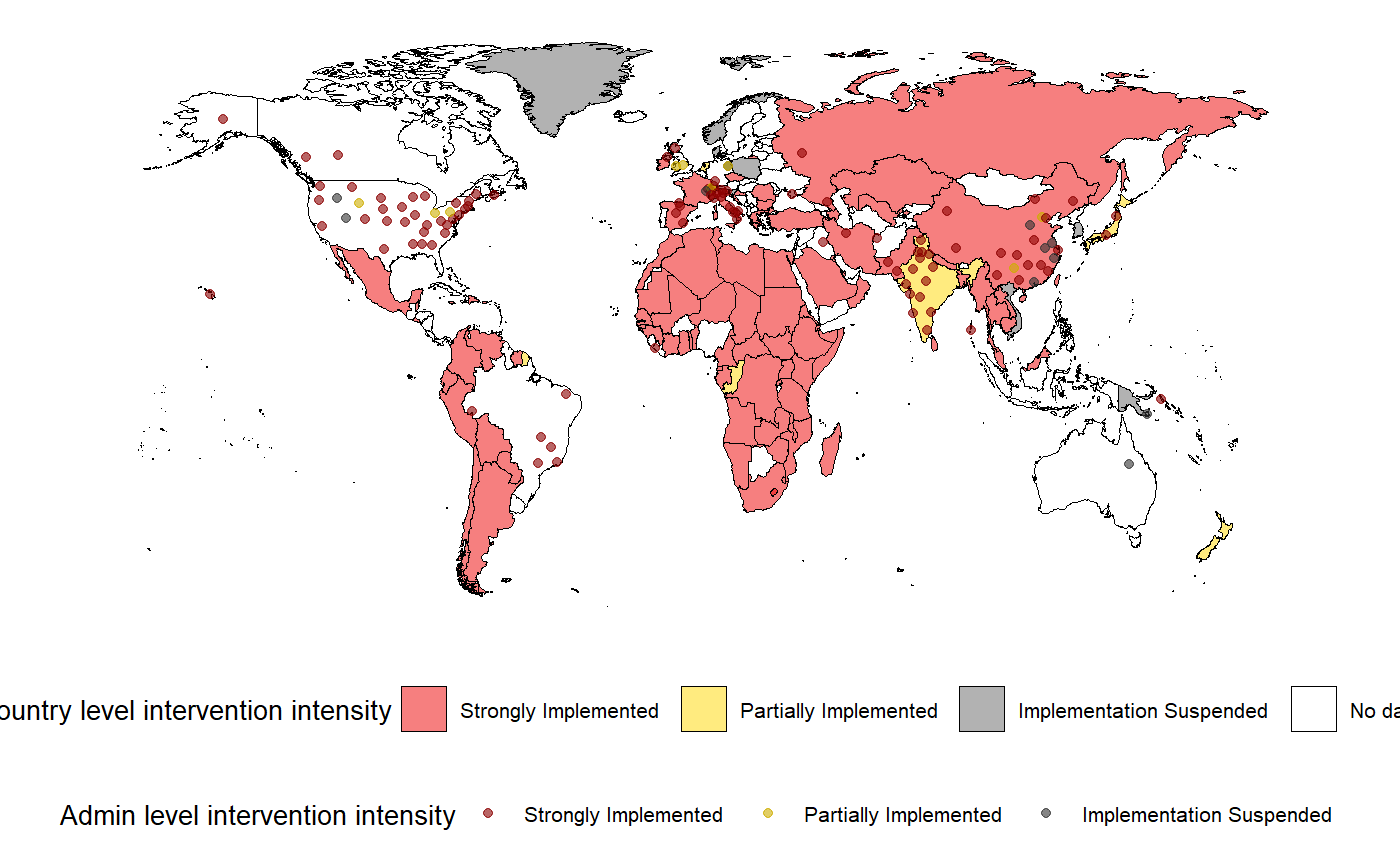
This function maps the status of a specified intervention at a specified date at both national and administrative level.
intervention_map(
  hit_data,
  time_point = Sys.Date(),
  intervention_group = NULL,
  date_format = "%m/%d/%Y"
)
Arguments
| hit_data | the full HIT-COVID database pulled from GitHub, pulled using hit_pull |
|---|---|
| time_point | character string indicating the desired mapping date (default is Sys.Date()) |
| intervention_group | vector of intervention group to filter the data to (see intervention_lookup column "intervention_group" or run get_interventions for options) |
| date_format | character string indicating the date format of |
Details
The HIT-COVID database must first be loaded with hit_pull and fed into this function.
The function draws a world map depicting the latest intervention status before the provided
time_point. If no value is entered for time_point, it will return a map of most
current intervention status. Both national level and administrative level data are mapped.
National level intervention data are represented by the color of the country polygons.
Administrative level intervention data are represented by circles. Both types of data are coded
in red (Strongly implemented), yellow (partially implemented) or gray (implementation suspended).
The strongest implementation intensity is used for mapping if for one territory there are
multiple entries in the same intervention group on the same day.
References
https://gadm.org/download_world.html
See also
Examples
# Puling the HIT-COVID database hit_data <- hit_pull(add_first_case = FALSE) # Mapping of most recent interventions in quarantine and home isolation domain intervention_map(hit_data, intervention_group = "quar_iso")# Mapping of latest school closures interventions before 5/24/2020 intervention_map(hit_data, intervention_group = "school_closed", time_point = "5/24/2020")

